ETS Fare Standards
Current adult monthly pass rates are $100. Single trip fares remain at $3.50. Users should allocate cash based on the Arc card reload patterns.
View Audit ReportMarket Data Analysis 2024
A technical breakdown of inflation rates, retail price fluctuations, and utility benchmarks specifically tailored for the Alberta capital region. These metrics are essential for calibrating your cash envelope system.
Section 01 // Monitoring
The Consumer Price Index (CPI) in Alberta has shown significant volatility over the last 18 months, primarily driven by energy costs and housing demand. According to recent provincial reports, the headline inflation rate fluctuates between 3.2% and 4.1% annually. For users of the cash envelope method, this means that static budget allocations for "Groceries" or "Fuel" must be reviewed quarterly to maintain purchasing power.
Our tracker focuses specifically on the "All-items excluding food and energy" and "Food" sub-sectors. While the national average provides a baseline, Edmonton's unique logistics and supply chain position often result in localized price spikes that exceed national figures by 0.5 to 0.8 percentage points.
"Effective cash management in high-inflation environments requires a transition from monthly to bi-weekly audit cycles. Without adjusting the physical envelope limits in response to CPI shifts, households risk a 15% deficit in essential spending categories by year-end."
— Small Room Note Financial Audit Team
Section 02 // Retail Logistics
The Edmonton-specific Retail Price Index tracks the cost of a standardized basket of goods across major local vendors including Sobeys, Real Canadian Superstore, and Save-On-Foods. In the Edmonton market, we observe a "northern premium" on produce during the winter months, which can increase grocery envelope requirements by up to 22% between November and March.
| Category | Baseline (2023) | Current (2024) | Variance |
|---|---|---|---|
| Fresh Produce (kg) | $4.12 | $4.85 | +17.7% |
| Grains & Legumes | $3.25 | $3.48 | +7.0% |
| Cleaning Supplies | $12.40 | $13.15 | +6.1% |
Our analysis indicates that retail pricing in Edmonton is heavily influenced by transportation costs along the QEII highway corridor. When diesel prices fluctuate, the impact is felt at the local retail level within 14 to 21 days. For more details on how to categorize these rising costs, refer to our Expense Classification Standards.
Section 03 // Utilities
Source: EPCOR and City of Edmonton Utility Rates
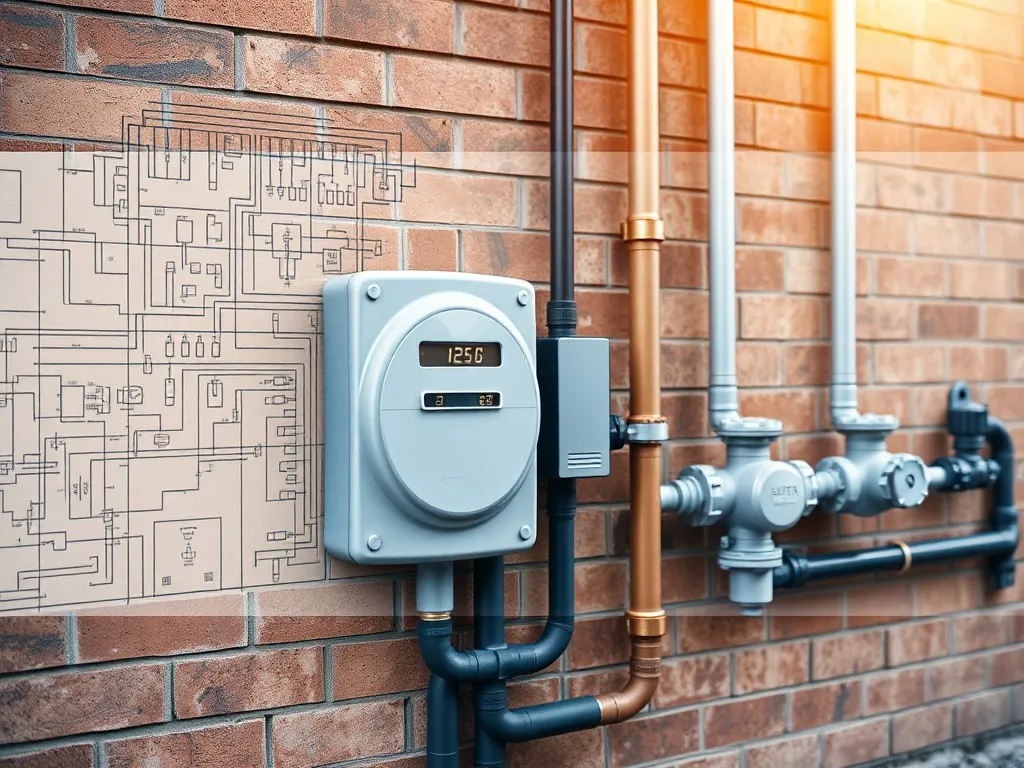
Edmonton utility costs, including electricity, natural gas, water, and waste management, are subject to both regulated and competitive rate structures. For a standard 1,200 sq. ft. detached home, the average monthly utility expenditure now ranges from $350 to $550, depending on the season.
The Regulated Rate Option has seen peaks exceeding 30 cents per kWh. We recommend a "Buffer Envelope" of $50/month to handle rate volatility.
Carbon tax increases and distribution fees account for nearly 45% of the total natural gas bill in the winter months.
To accurately fund your utility envelopes, you must calculate a rolling 12-month average. We provide detailed technical specifications on how to integrate these fixed but variable costs in our Technical Specs documentation. Failure to account for the "Fixed Delivery Fees" often results in underfunding the utility category by approximately $120 per quarter.
Section 04 // Transit & Fuel
Current adult monthly pass rates are $100. Single trip fares remain at $3.50. Users should allocate cash based on the Arc card reload patterns.
View Audit ReportEdmonton average for regular unleaded is $1.35 - $1.52 per liter. We track weekly variances to assist in fuel envelope calibration.
Logistics GuideLabour rates at local service centers have risen to $145/hr. A dedicated "Vehicle Sinking Fund" is now a system requirement.
Tools DatabaseUsing outdated pricing data leads to system failure. Download our latest compliance standards to ensure your envelope allocations meet current Edmonton economic benchmarks.